
Marion County · I-75 corridor
Ocala Commercial Real Estate
Ocala carries far more lease inventory than sale inventory. The Stellar MLS snapshot of October 29, 2026 showed 133 active lease listings against 69 for sale, and the lease side was led by office with 50 listings, followed by retail with 26, industrial with 21 and warehouse with 17. It was the largest lease inventory of any city built so far in this series.
On the for-sale side, 29 of the 69 listings asked under $500,000, 15 asked $500,000 to $1 million, 21 asked $1 million to $3 million, and four asked $3 million or more, with a top ask of $12.5 million. The median ask was $715,000 and the median asking price per square foot was $201 across 51 listings. Mixed-use led with 16, then office with 14, business listings with 12 and industrial with eight. Thirty-six of the 69 had been on the market more than 180 days, yet 15 had been listed within the past 60, the most fresh supply of any city in this batch. Twenty-six were priced below their original ask, with a median cut of 9.5%, and the median year built was 1974.
The paragraphs above describe the October 29, 2026 snapshot. The figures below update with the feed.
Ocala active inventory
Active for sale
66
Active for lease
135
Priced below original ask
28 of 66
Active for-sale listings
Median asking price
$705K
n = 66 for-sale listings
Median ask per SF
$201
n = 49 with usable building area
Median days on market
173
n = 66 active listings
For-lease property mix
- Office51
- Retail29
- Industrial20
- Warehouse14
- Business12
- Mixed Use5
Counts of active lease listings by property subtype. The feed reports no rent figures.
For-sale property mix
- Office14
- Mixed Use13
- Business12
- Industrial8
- Retail5
- Warehouse5
For-sale asking-price bands
- Under $500K28
- $500K – $1M15
- $1M – $3M20
- $3M and up3
28 of 66 listings are priced below their original ask; the median reduction is 10.7%.
Method and limits
Source: Stellar MLS, distributed through MLS GRID, active commercial-sale and commercial-lease listings with a city of Ocala, FL; newest record updated November 12, 2026. These are asking prices on active listings, not sale prices: this page shows no closed-sale data. Medians appear only when at least 5 listings support them, and the sample size is shown. Price per SF uses listings with a usable building area. Cap rate is not shown because fewer than 5 listings in Ocala report one. Lease figures here are counts of listings, not square feet, and the feed reports no rent figures, so nothing on this page speaks to asking rents. Business listings are business opportunities, which may be priced as an operating business rather than as real estate alone.
Active commercial listings in Ocala
Live MLS inventory in Ocala, Marion County.
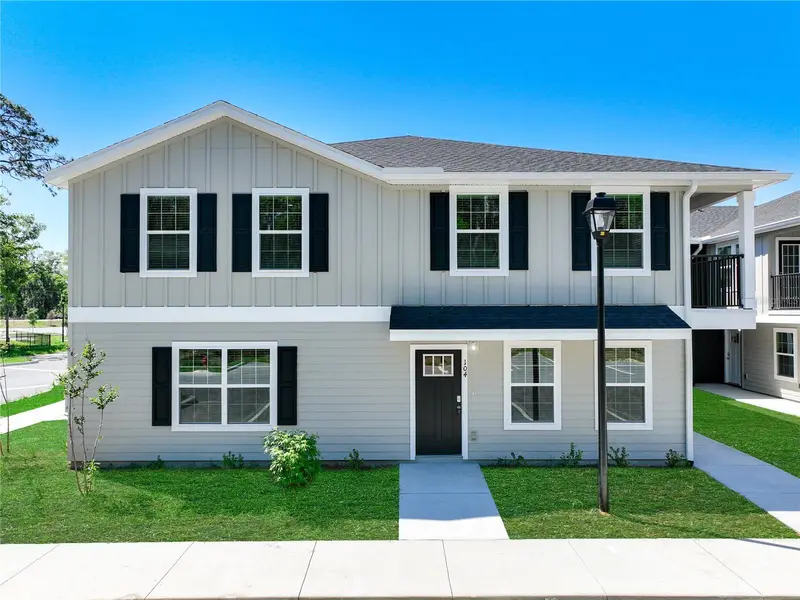

$12.50M
3821 Sw 43rd Ct
Ocala, FL 34474
7.07 ac · Built 2025
MLS #OM709317, SUNCOAST PROPERTY MANAGEMENT L.
Listing provided by Stellar MLS
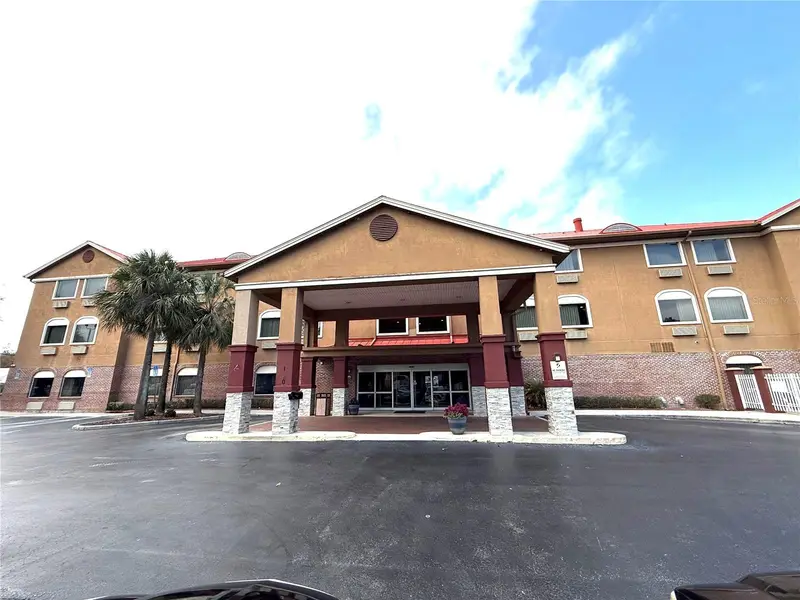
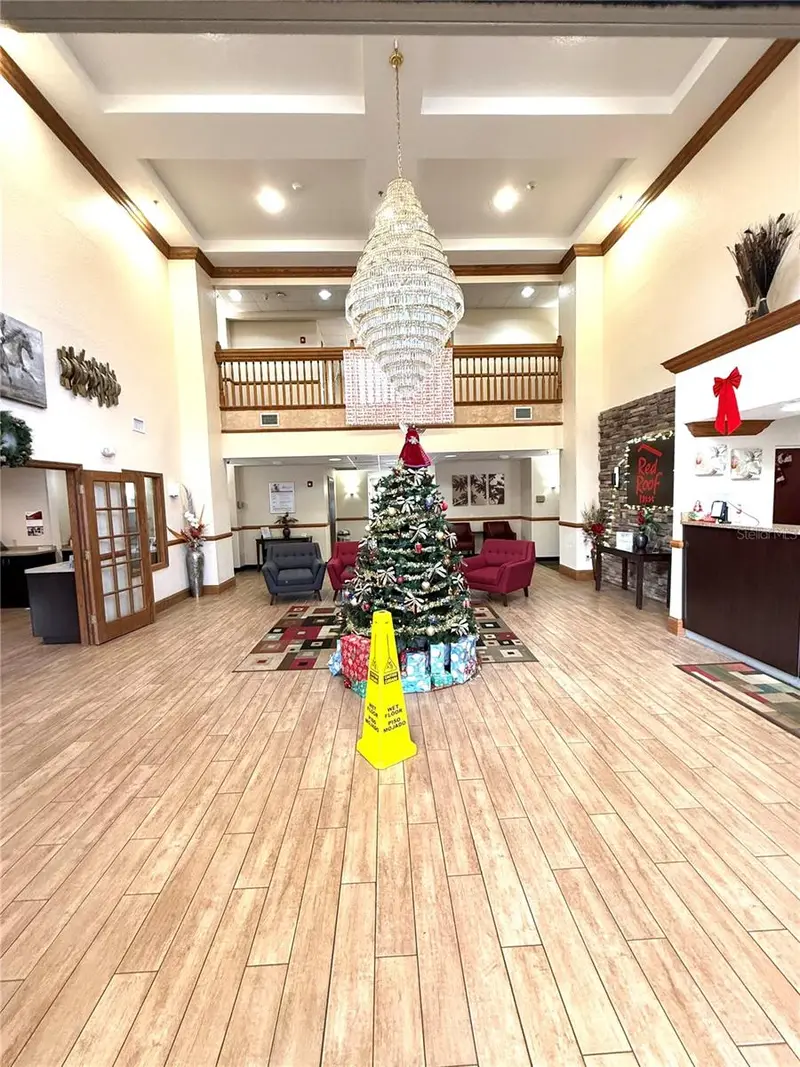
$6.20M
120 Nw 40th Ave
Ocala, FL 34482
30,828 SF · 1.68 ac · Built 2003
West Ocala Heights
MLS #TB8466780, IMPACT REALTY TAMPA BAY.
Listing provided by Stellar MLS
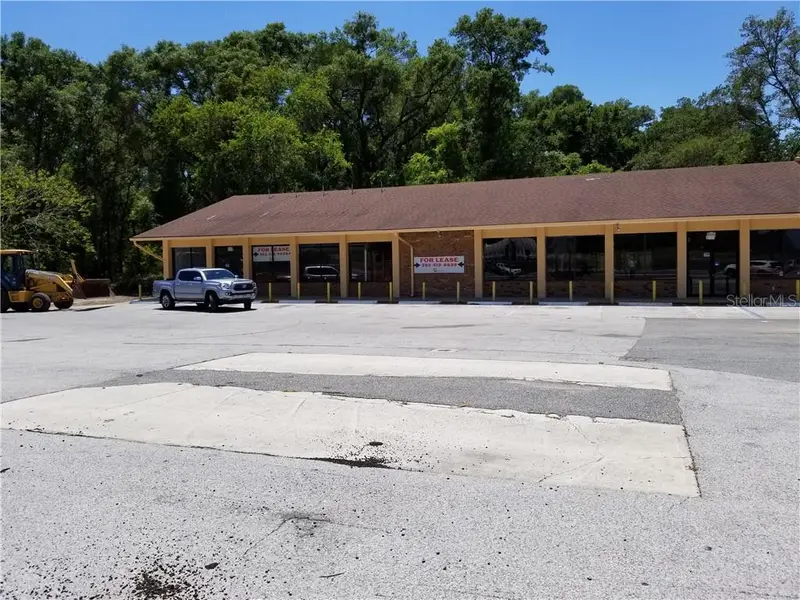
$3.50M
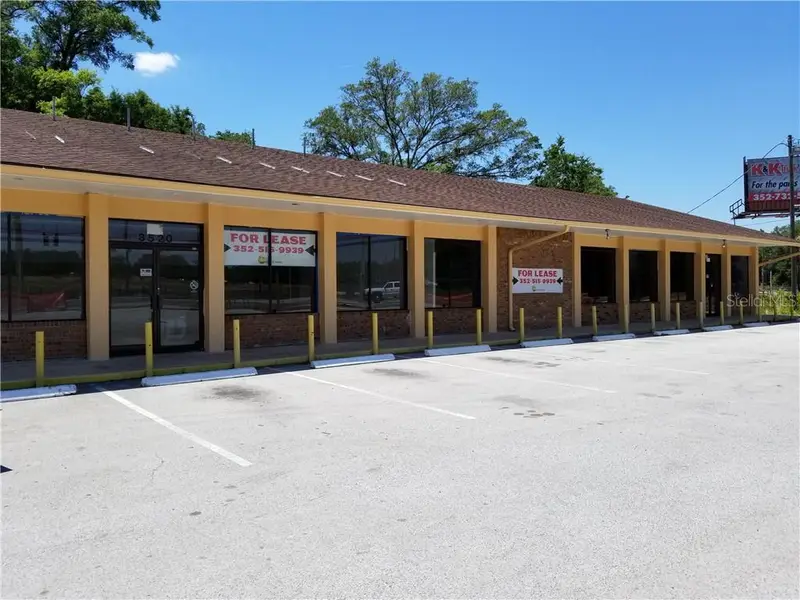
3520 W Highway 326 Hwy
Ocala, FL 34475
5,700 SF · 3.96 ac · Built 1984
MLS #OM605582, VANDERBILT REALTY LLC.
Listing provided by Stellar MLS
$2.90M
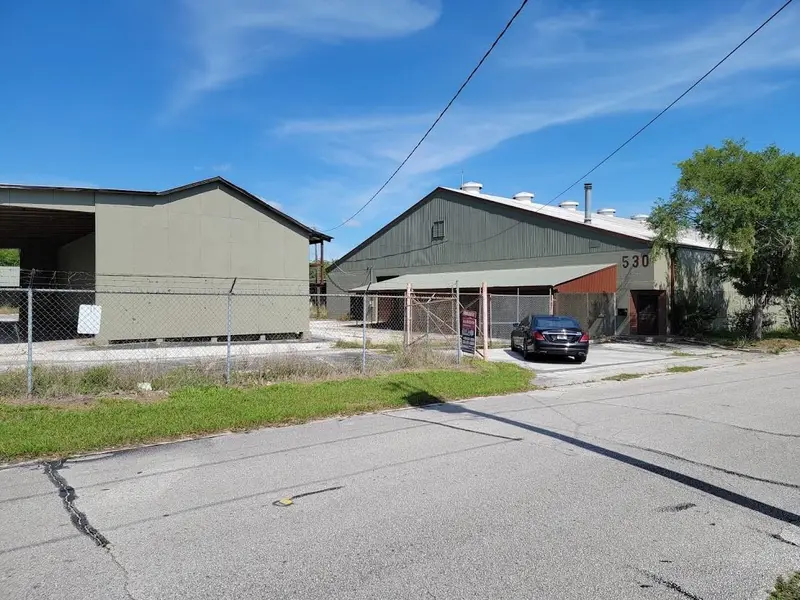
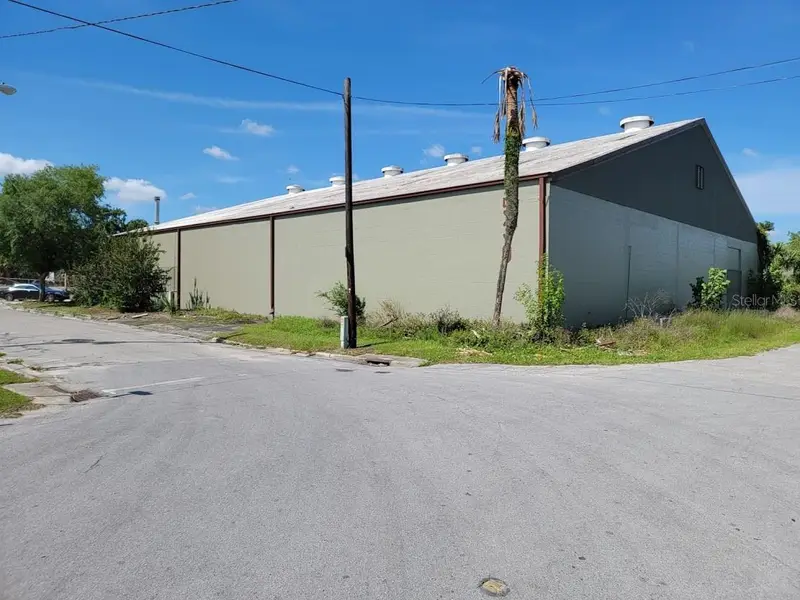
530 Nw 1st Ave
Ocala, FL 34475
2.45 ac · Built 1955
Dunns Central Add
MLS #OM618742, BILL RODGERS REALTY.
Listing provided by Stellar MLS
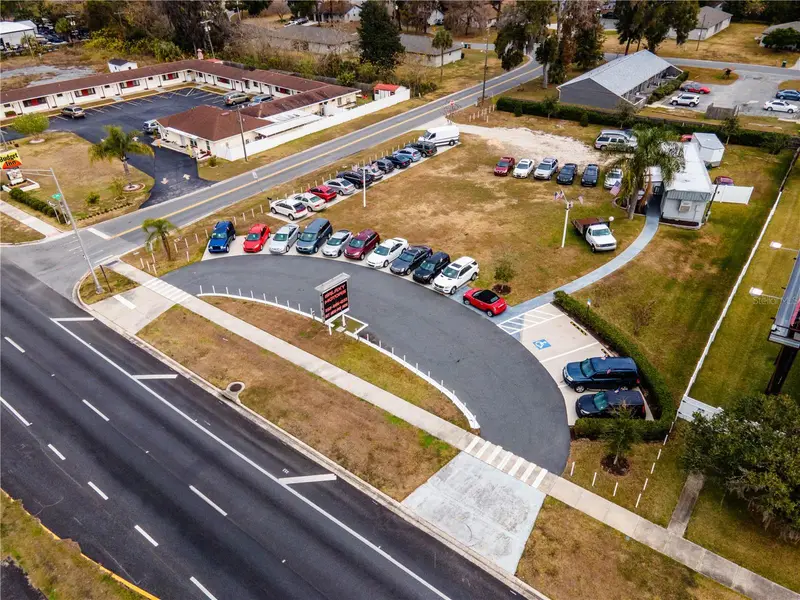
$2.50M
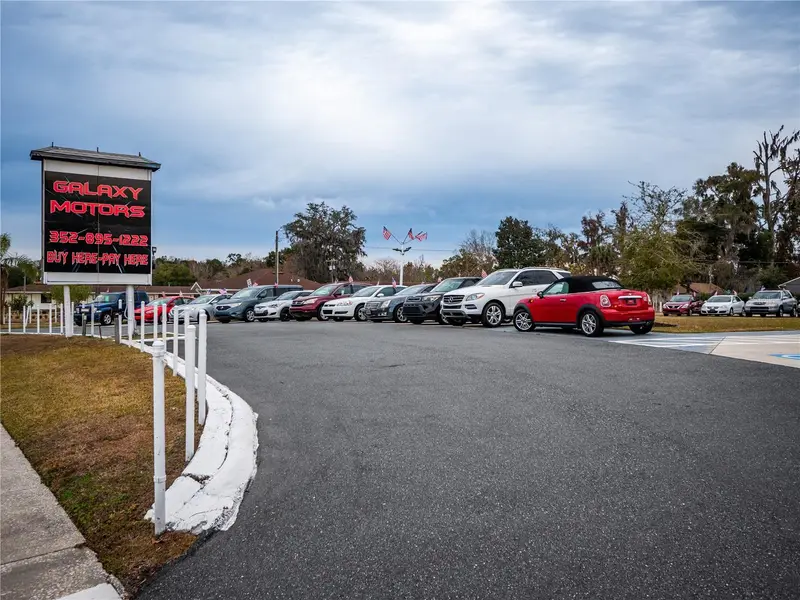
3001 S Pine Ave
Ocala, FL 34471
895 SF · 0.75 ac · Built 1990
Southwood
MLS #OM698249, INVICTUS REAL ESTATE LLC.
Listing provided by Stellar MLS
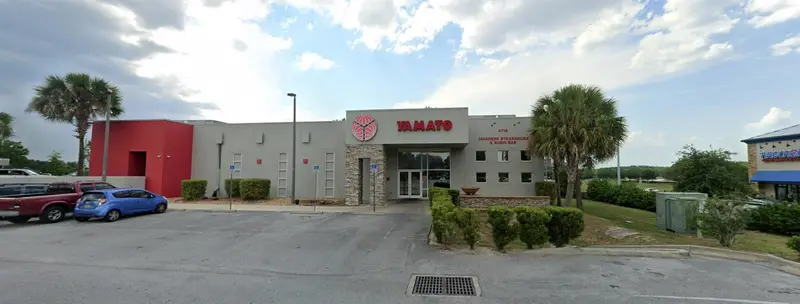
$2.50M
4714 Sw College Rd
Ocala, FL 34474
6,587 SF · 1.08 ac · Built 2008
Heathbrook North B-2
MLS #GC534942, BOSSHARDT REALTY SERVICES LLC.
Listing provided by Stellar MLS
Listings courtesy of Stellar MLS as distributed by MLS GRID. Data deemed reliable but not guaranteed.
Get Ocala deal alerts
Tell us what you are buying and we will send Ocala-area commercial listings that fit. Ryan Solberg, Florida Real Estate Broker (BK3354351), MaxLife Commercial.